Part 1: Final Project
This project focuses on the repercussions of the increasing popularity of fast fashion across the globe. The setup of this project highlights how fast fashion has grown in recent years, owing to more frequent and possibly cheaper availability of apparel. Following this preamble, it would establish a conflict by navigating the audience through specific social and environmental issues associated with the adoption of this trend. Finally, it would suggest a possible resolution to the identified problem by introducing sustainable fashion trends and corrective action required on part of the consumers.
Project Outline With Sketches
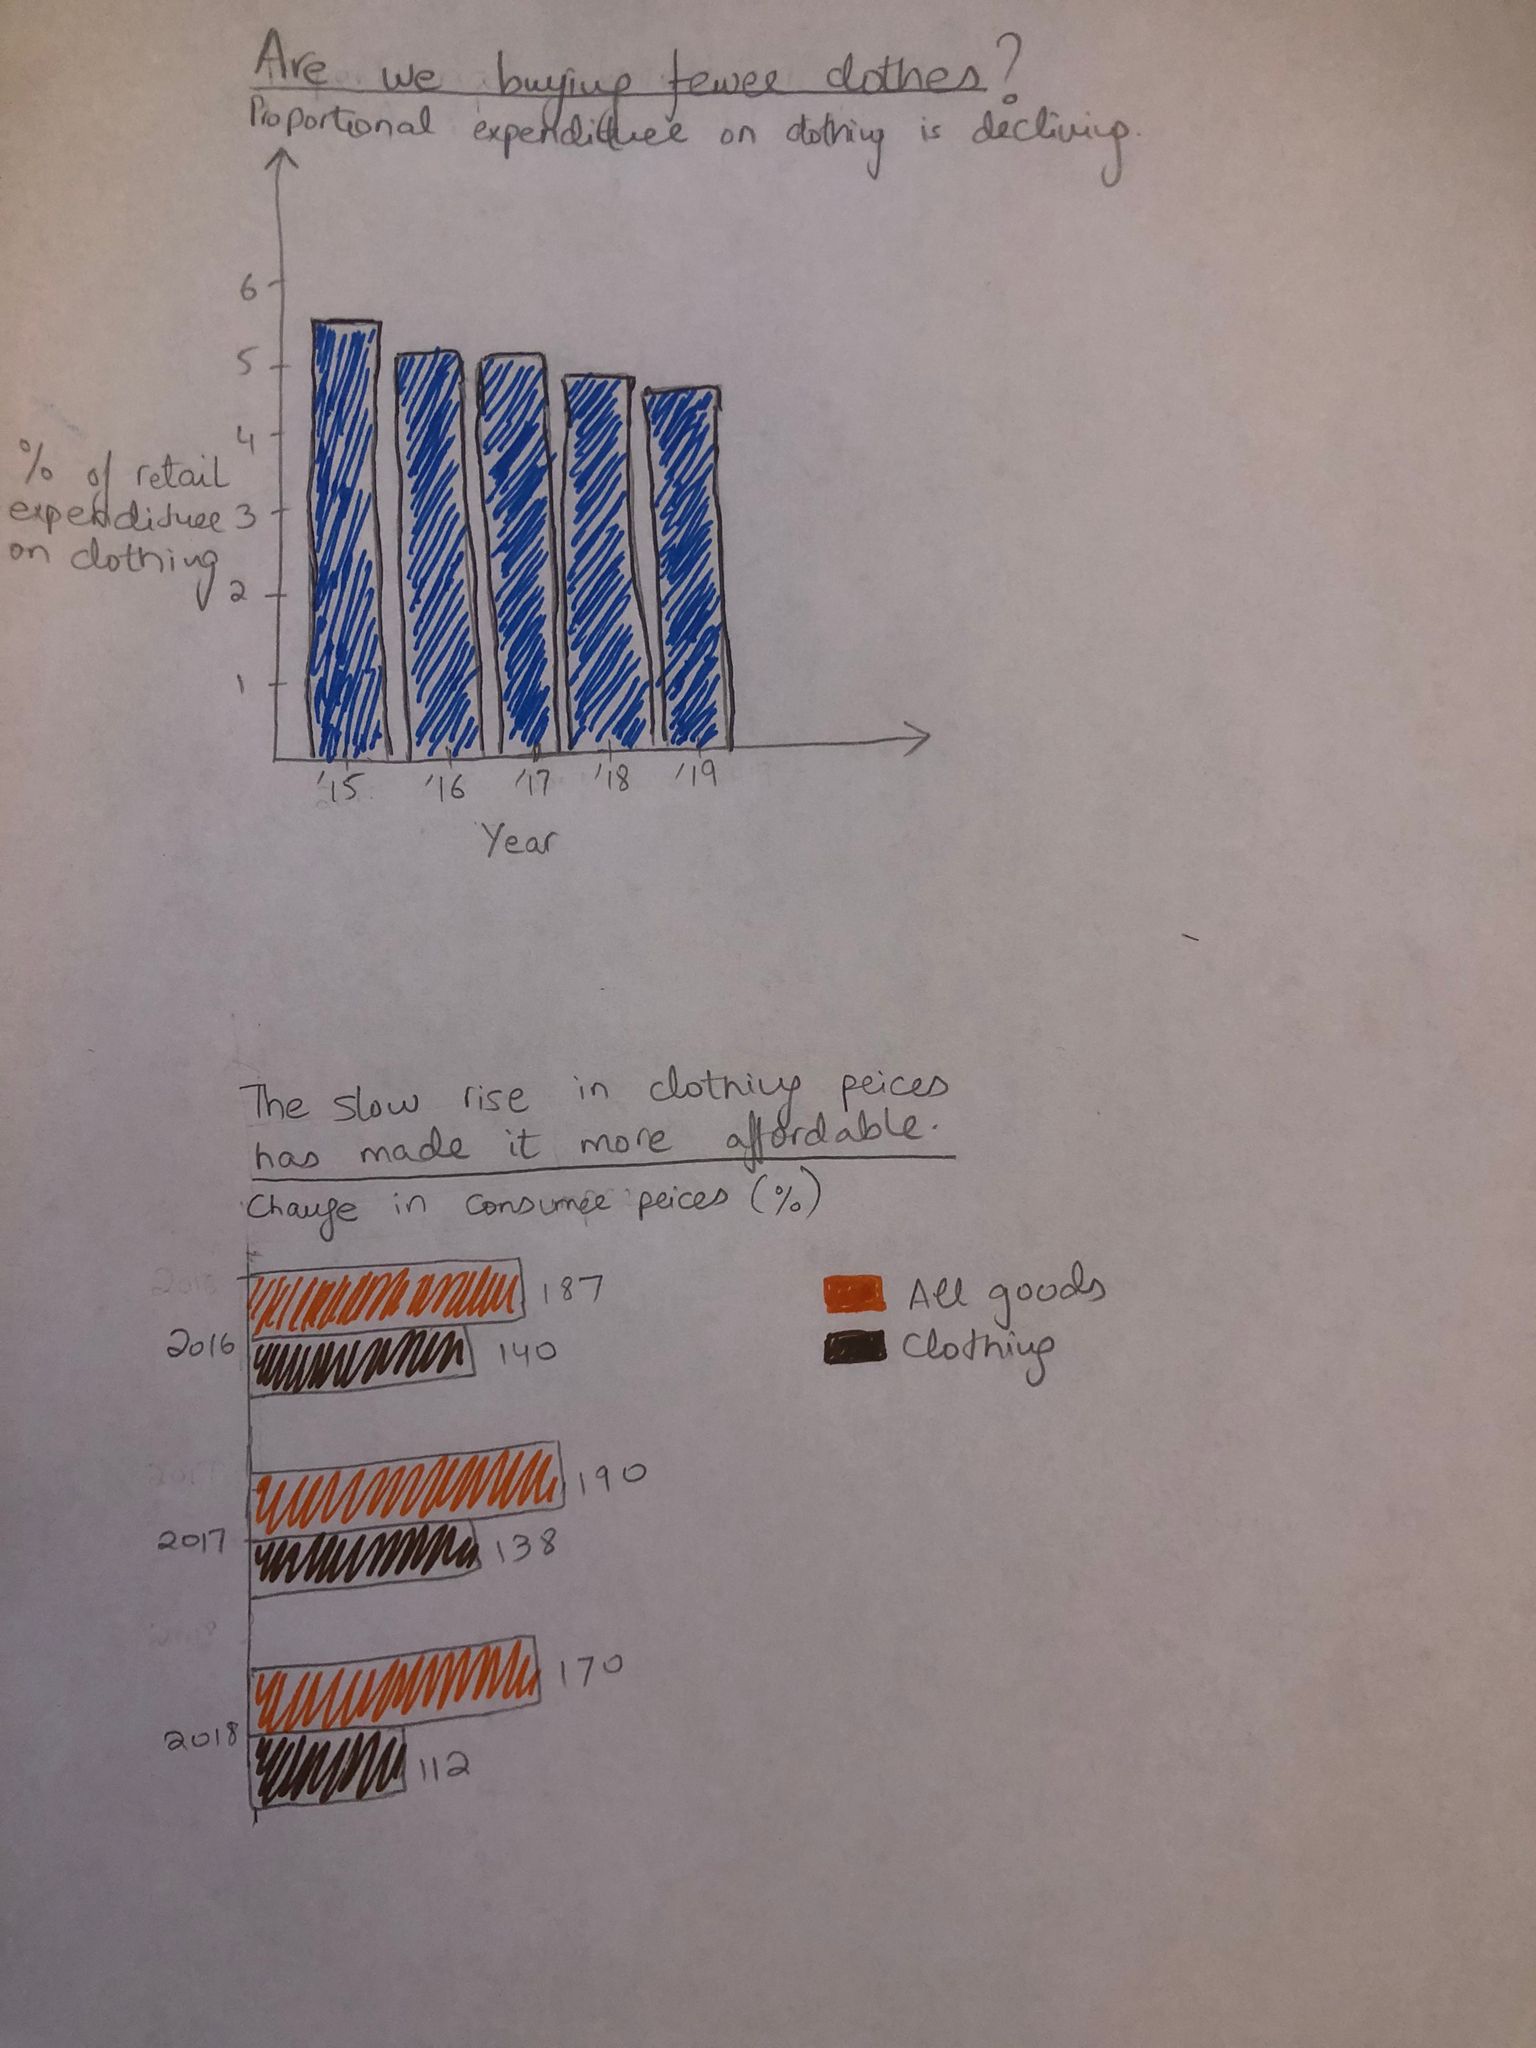
1. Are people spending more on clothes now?
This section would show how expenditure on clothing as a fraction of total retail spending per capita has fallen over the years. This would help negate the premise of the project and build some context regarding how individuals might have a tendency to only assess a part of the story. A visualization would immediately follow showing how prices in the apparel industry have indeed risen at a lower rate compared to other retail items, which explains a fall in proportional expenditures but not necessarily a fall in consumption.
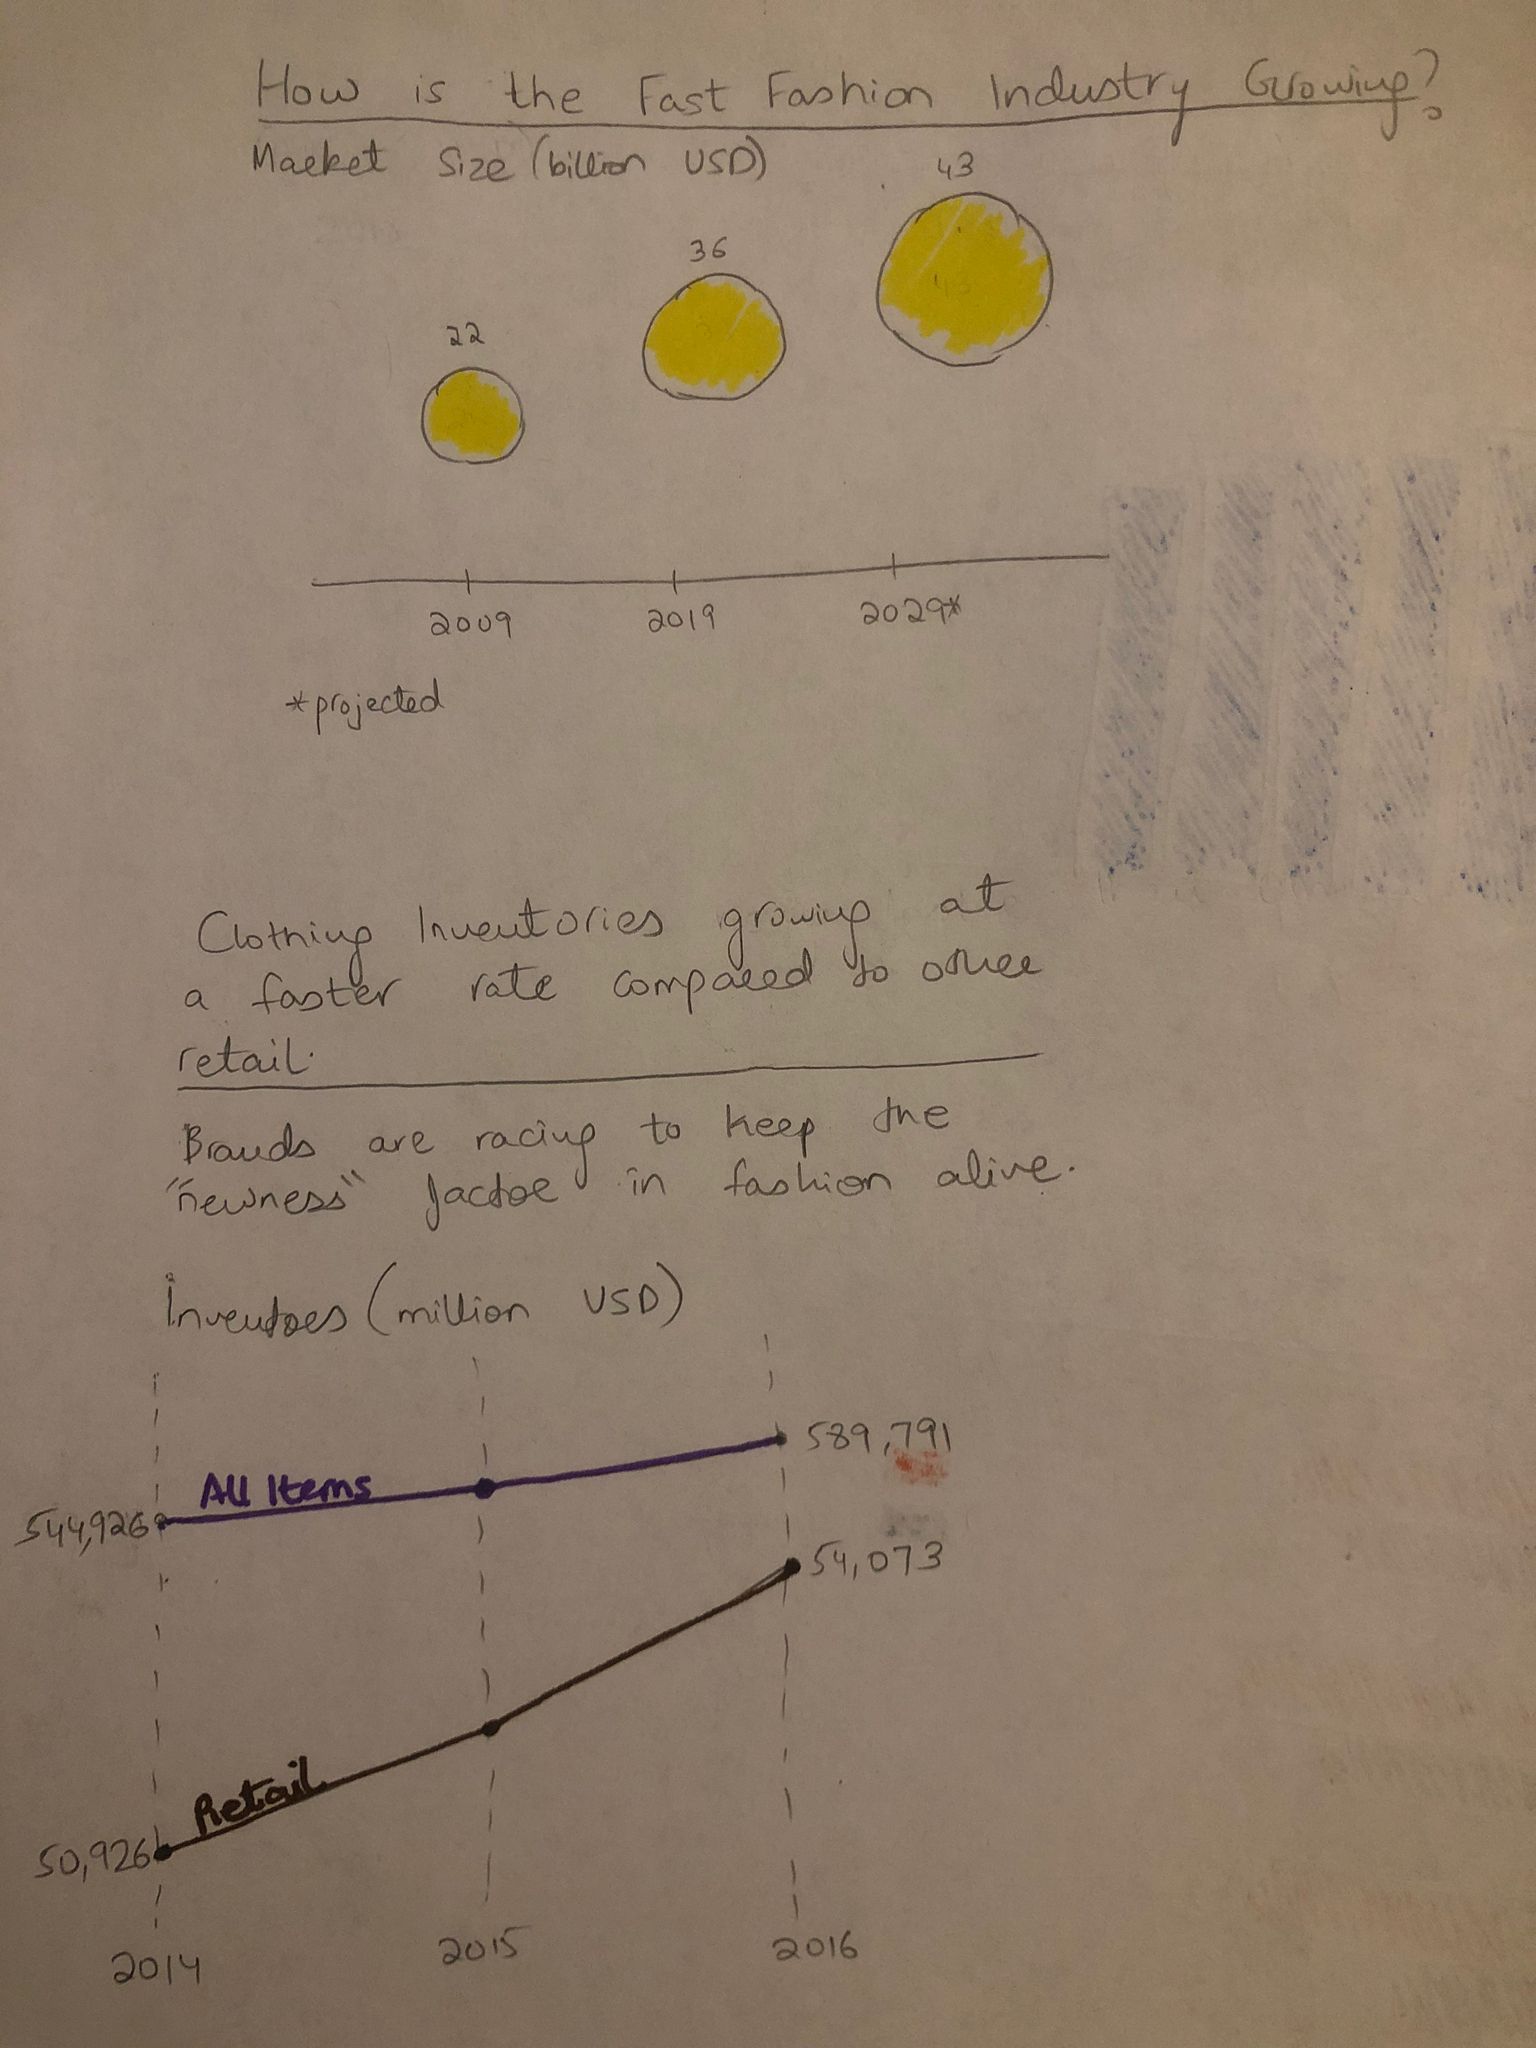
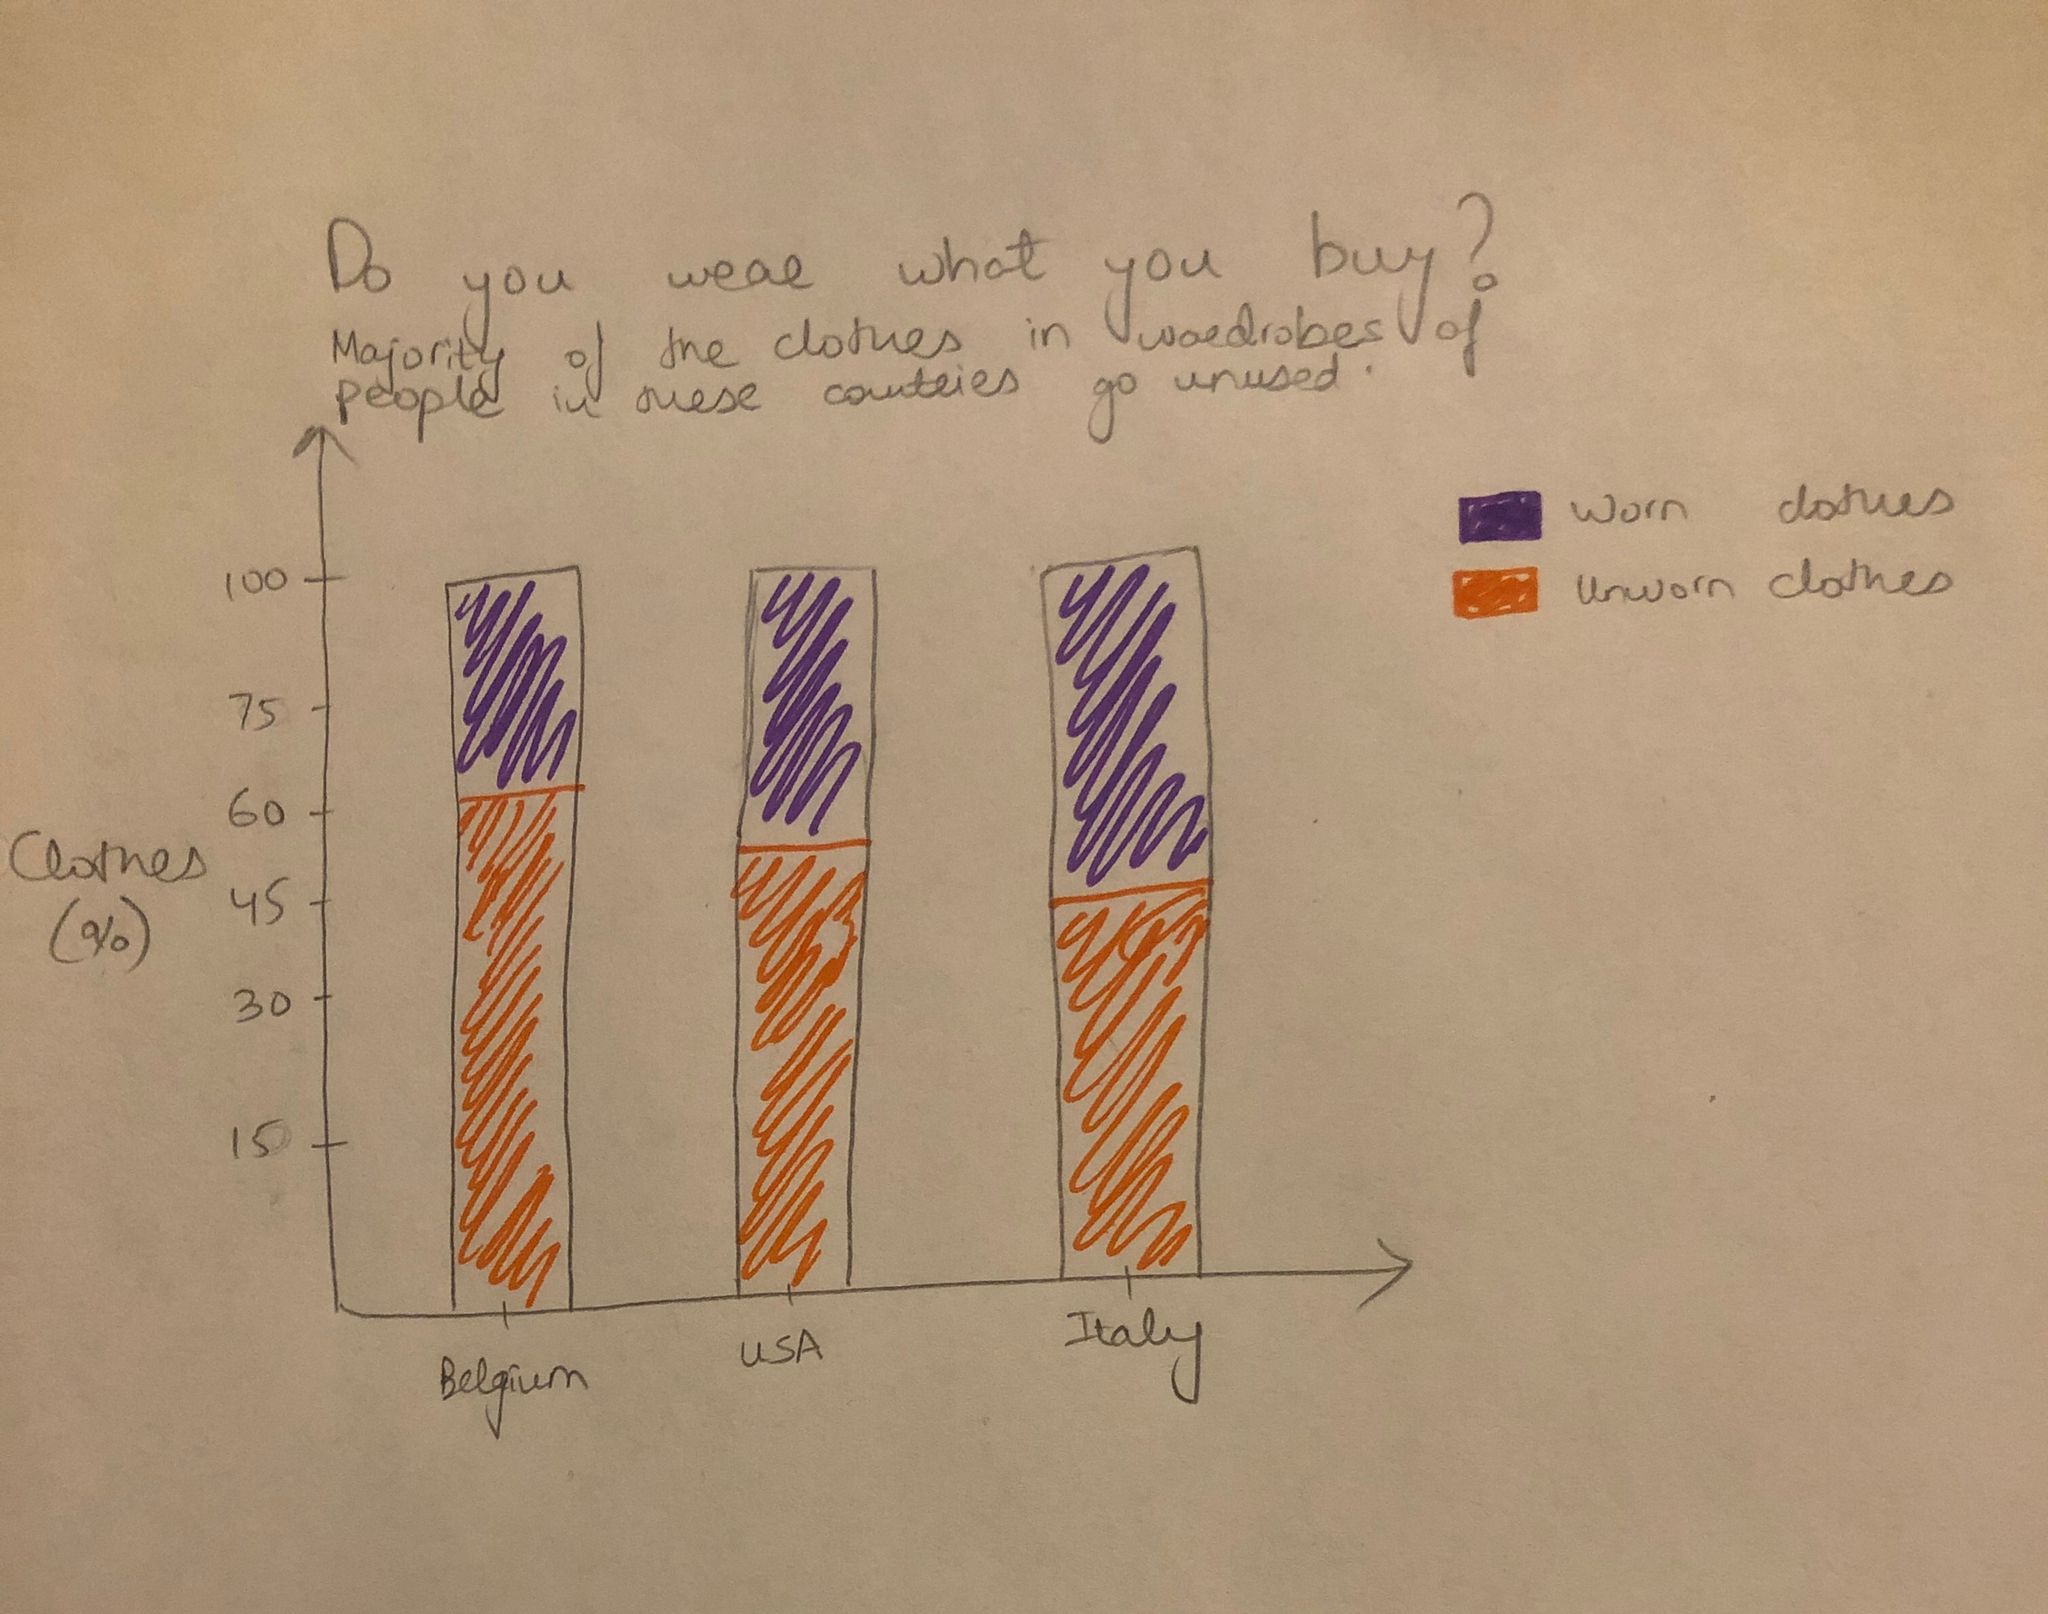
2. Is fast fashion leading to excess apparel consumption?
This section intends to convey the scale at which the fast fashion industry is growing along with a forecast of how it is expected to grow. To reinforce the “fast” in fashion, a visualization would highlight how retailers now have to hold growing inventories to keep the “newness” factor in apparel alive. Based on this context, I will try to link how there has also been a corresponding increase in apparel consumption through a stacked bar chart which will show the percentage of unworn clothes in the wardrobe across different countries. Another possible visualization that could be used here is a scatter plot, which would convey that a significant fraction of respondents, from a survey in a Middle Eastern country, owned more than 200 items of clothes. This would hopefully ring the first alarm bell!
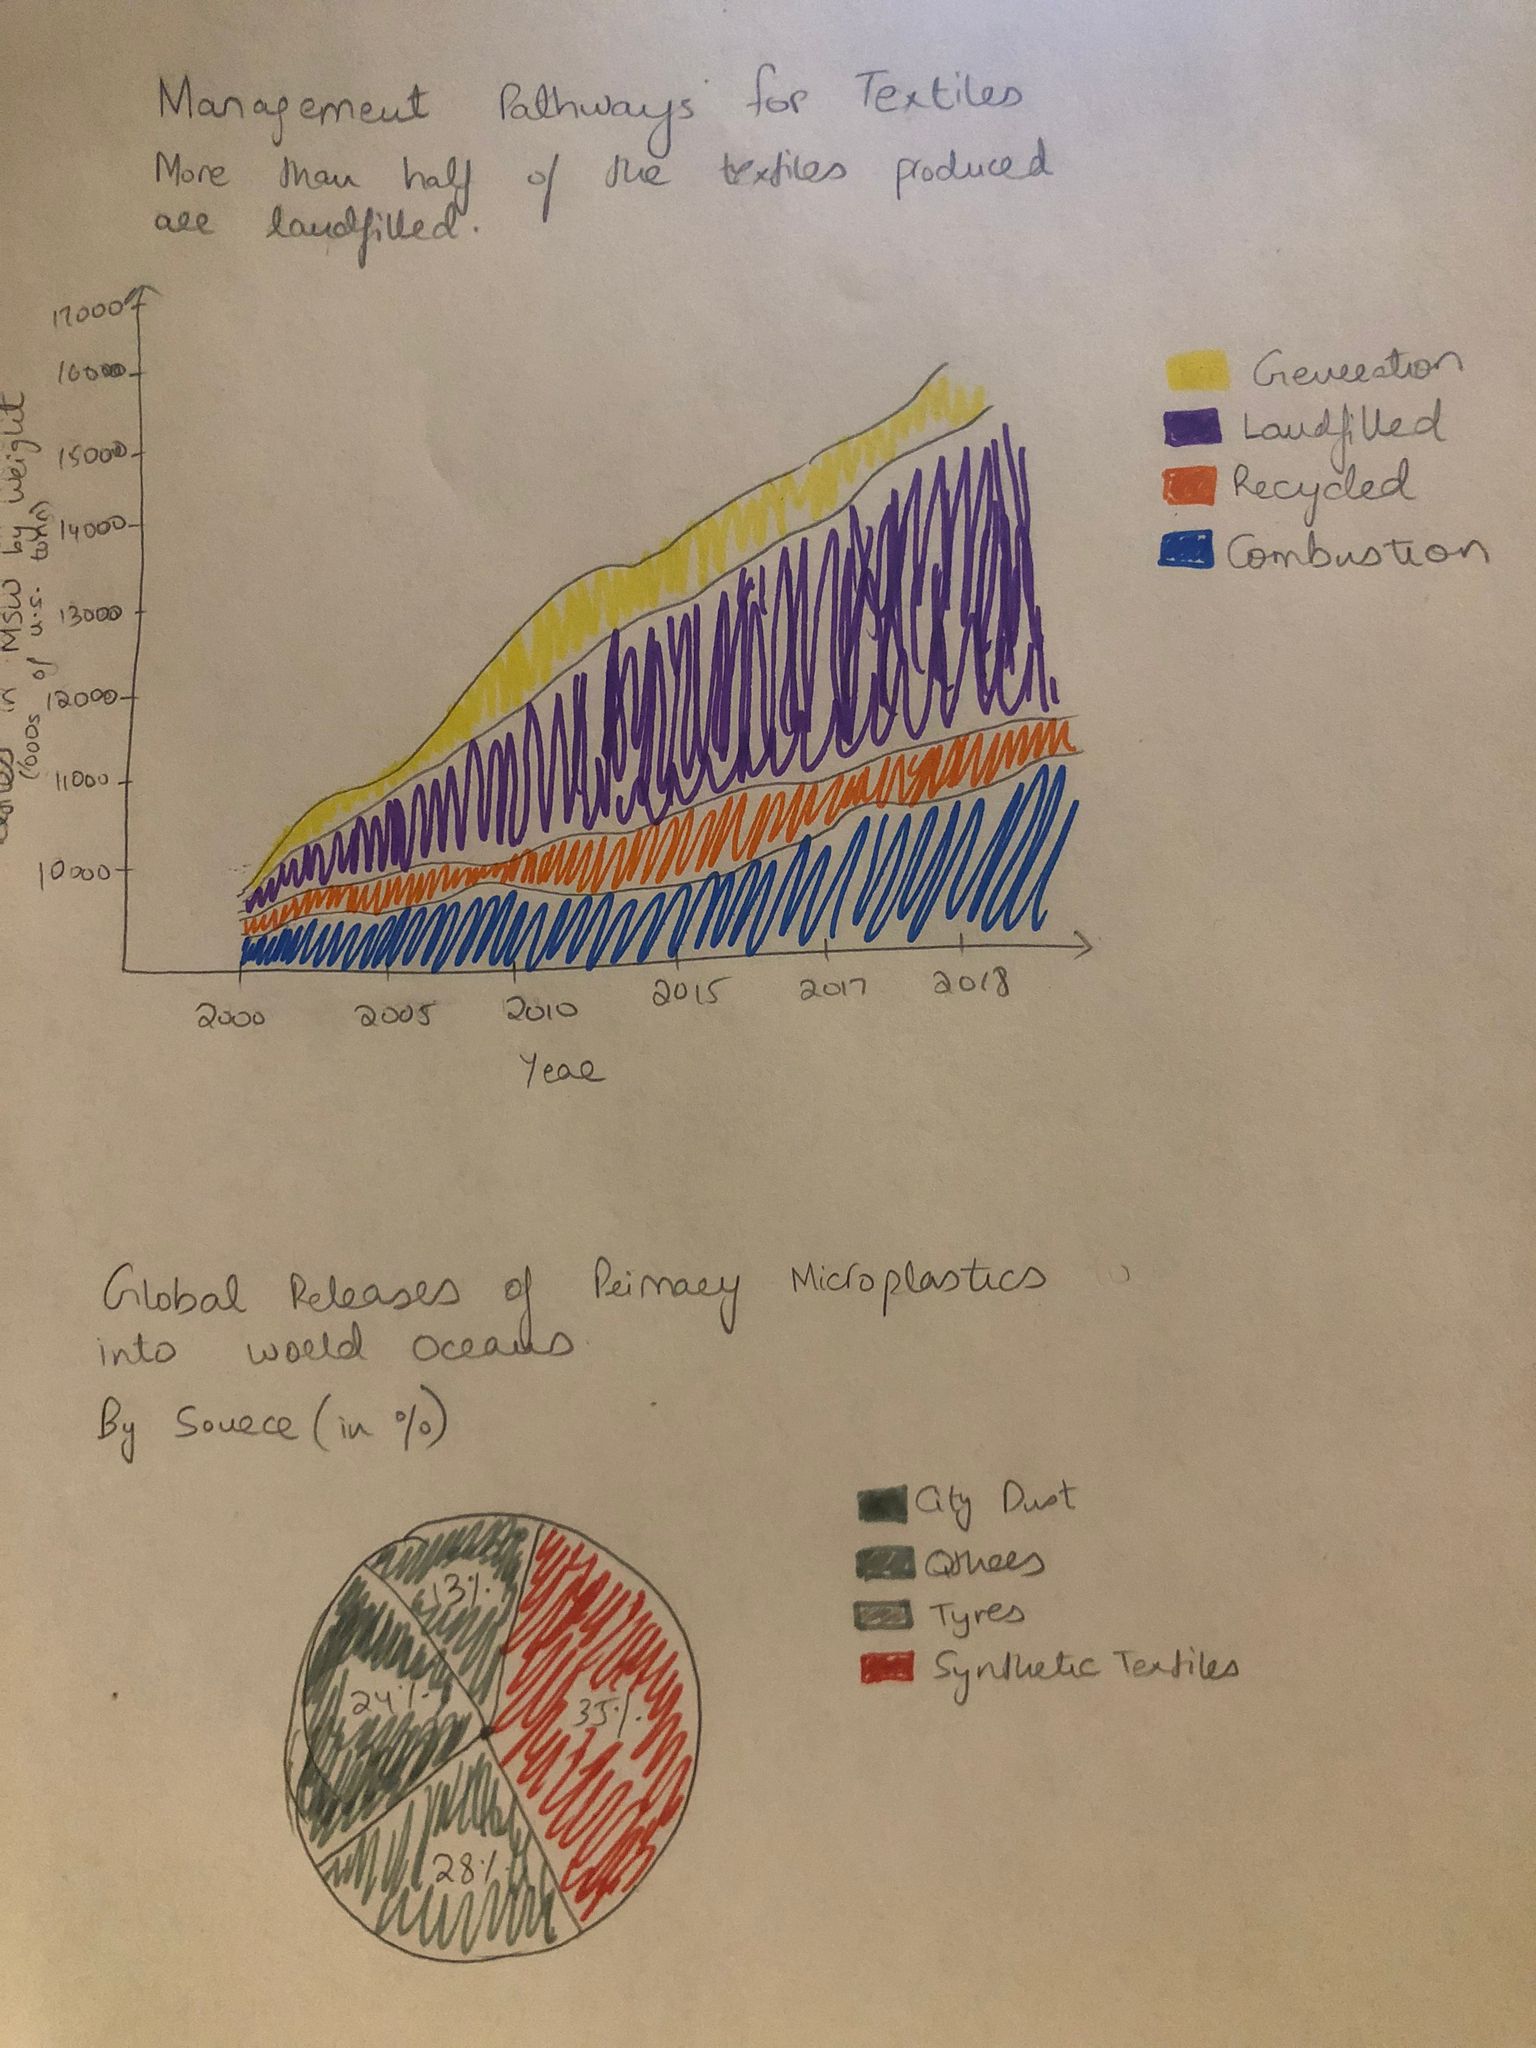
3. Why should we be concerned about fast fashion?
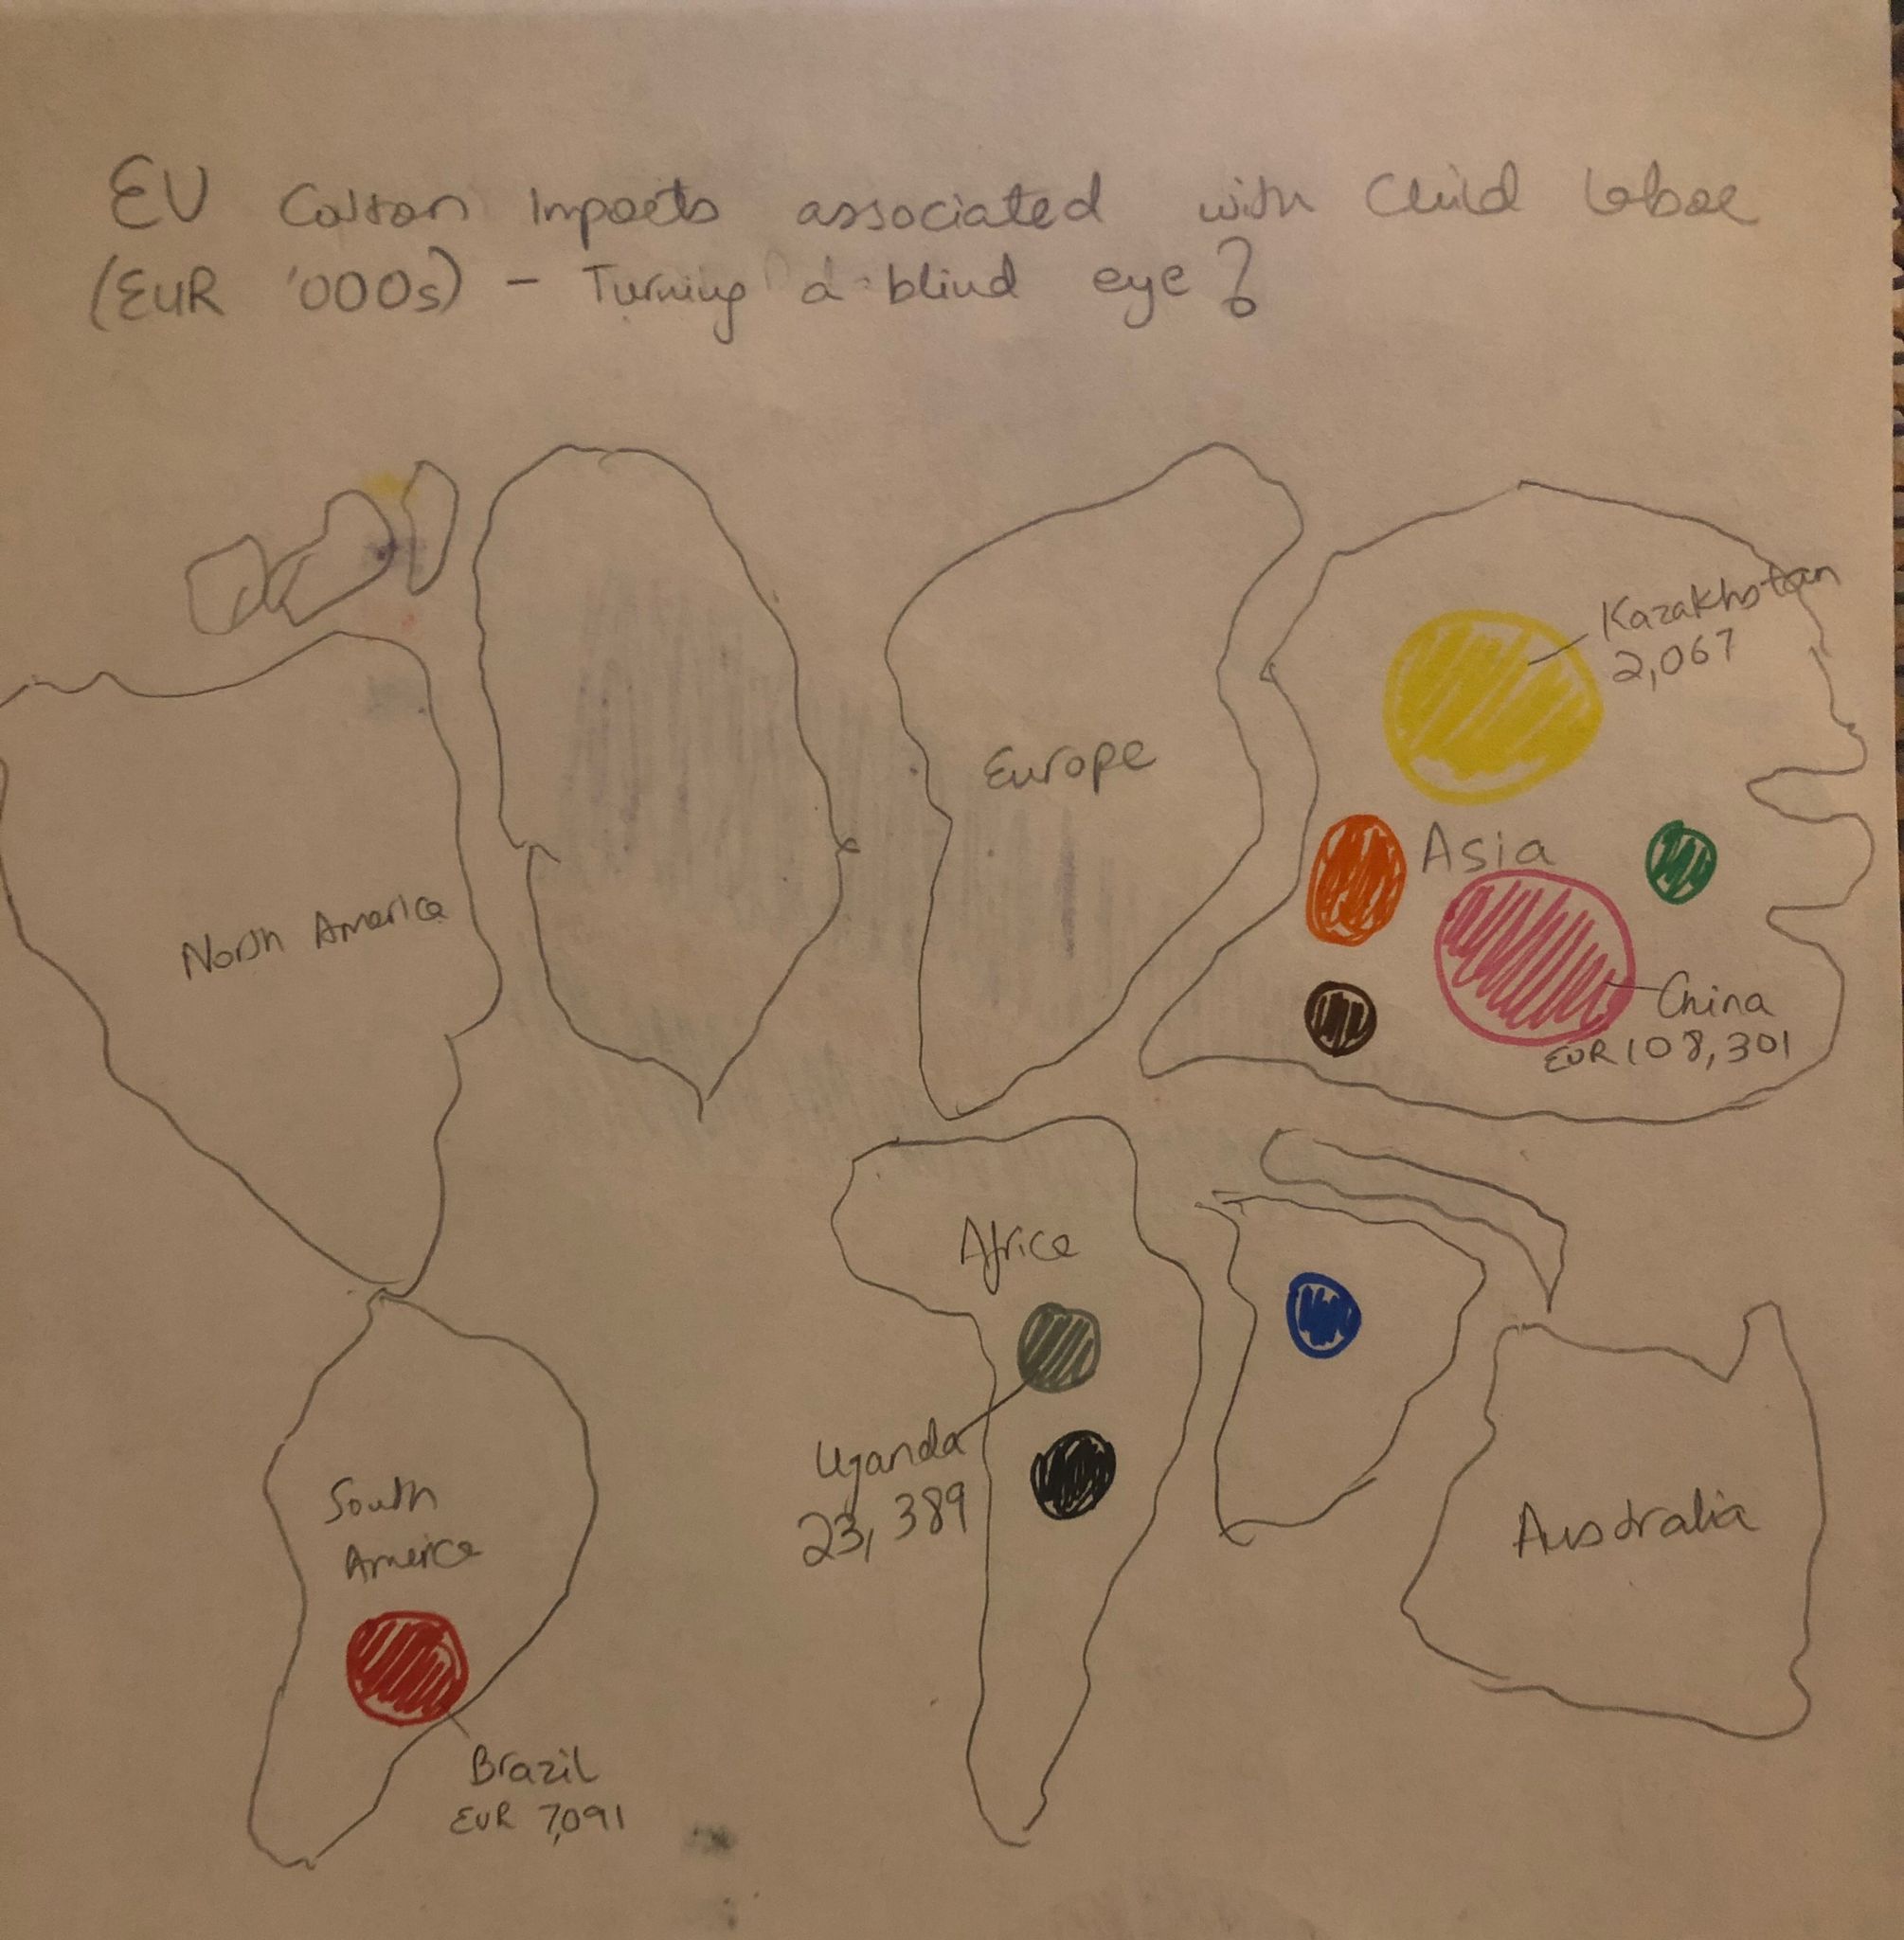
Brands are dumping more than half of what they are producing. To establish credibility of this claim, I would present an area stacked graph showing the percentage of textiles generated which end up in landfills, questioning the viability of the fast fashion trend. Moreover, PP & A (polyester, polyamide, and acrylic) and fibers, which are the primary raw materials for clothing, are the third biggest contributor to the global plastic production. This explains why synthetic textiles occupy the greatest segment of the pie for global releases of primary microplastics to the world oceans. A table reflecting the carbon footprint of leading European apparel retailers would be shown here to help the audience understand the environmentally irresponsible attitude of popular brands. Finally, I would discuss the role of child labor involved with cotton imports into the European Union, which are mainly used in apparel manufacturing. This could be represented using a map to highlight the negligence of governments in holding apparel brands accountable.
4. Know before you buy.
One garbage truck of clothes is burned or landfilled every second, enough to fill 1.5 Empire State buildings every day! Before you buy a cotton shirt again out of pleasure, remember that it takes 2,700 liters of water to make one of these, which is enough to sustain one person for 2.5 years. Every pair of Levi’s jeans also contributes to: climate change, excessive water consumption, eutrophication, land occupation and abiotic depletion. A closing infographic could serve as food for thought here!
5. Call to Action.
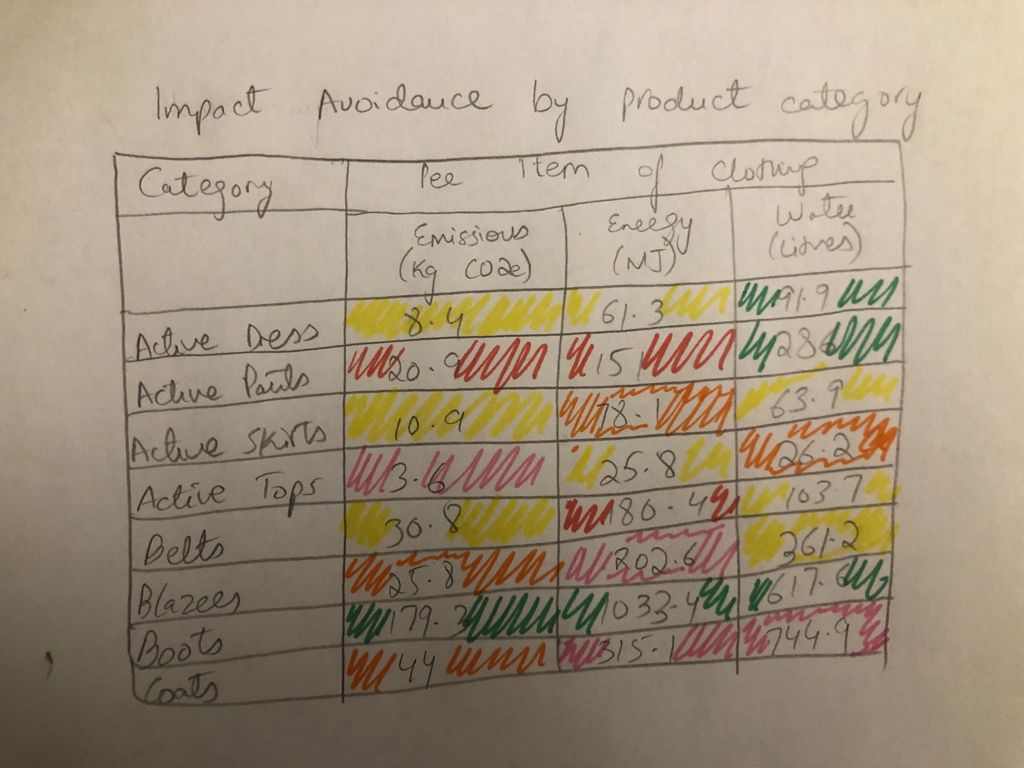
McKinsey & Co. has highlighted increasing clothing utilization and improving recycling as two of the four ambitions for a new textile economy, where we as consumers can certainly play a part. It is important for consumers to buy from responsible brands such as Eileen Fisher, which are introducing programs such as ReNew, through which they accept any of their old clothing back, regardless of the condition. The next time you don’t buy a pair of shoes that you don’t really need, don’t feel disappointed because you have contributed to the environment. This heatmap, showing the savings that could potentially come from averting production of each item of clothing, can probably make you feel better about the purchase choices that you make. Curtail the demand, and the supply will follow suit!
The Data
To build my narrative on the “Setup, Conflict and Resolution framework”, I explored datasets that could address each of these. Since I may not be including all the visualizations discussed above in my presentation, I may end up using fewer datasets than the ones provided below.
Setup
- The dataset on Per Capita Sales (2000 - 2019) from the Annual Retail Survey would be used to show the expenditure on clothing as a fraction of total retail spending per capita.
- The dataset on Revised seasonally adjusted indexes and factors, 2016-2020 from the US BLS’ CPI Seasonal Adjustment Tables would be used to show a comparison of price changes of clothing items versus all retail items.
- The dataset from Monthly Retail Trade Survey would be used to show how inventories held by retail stores in the United States have grown over the years.
- The table providing the percentage of unworn clothes in the wardrobe across different countries would be used from this article as proxy to visualize apparel consumption and its excess.
- This dataset from Fashion Research conducted by the Holon Institute of Technology would be used to represent the distribution of clothes ownership in a specific country.
Conflict
- The table on United States EPA website will be used to show the percentage of textiles generated, which are either recycled, combusted or landfilled.
- This table would be used to show the primary plastic production by polymer type in 2015 to highlight how PP & A and Fibers are one of the leading contributors.
- The figure Global releases of primary microplastics to the world oceans from the report would be used to recreate a visualization for showing the main sources of ocean pollution.
- This link from Statista would be used to download an excel file for showing the Annual total carbon emissions released by leading European apparel retailers in 2019. The data can be viewed for free following account creation!
- This report would be used to show the value of EU cotton imports from different countries, which have possibly been produced with child labour.
Resolution
This section would primarily rely on insights from the reports: Water, Energy and Emissions Savings from Reuse of Clothes to signify the impact of environmental savings from reuse of clothes; A New Textiles Economy: Redesigning fashion’s future to highlight the four main ambitions for a revamped textile economy; Responsible Brands Recycling to talk about brands which are adopting sustainable practices and should be the ideal purchase choice for consumers. The insights and claims made in the outline above draw information from this report.
Method and Medium
To draft my thought process and knit the elements of the story together, I would use Balsamiq to create wireframes and storyboards. For visualizations, I would use Flourish due to its ease of use and Tableau where I need more flexible functionality. In terms of images, I would explore Unsplash to find images that could leave an impact on the audience and also relate to my narrative. Finally, to create the story website by coalescing all sections, I would be using Shorthand.